 |
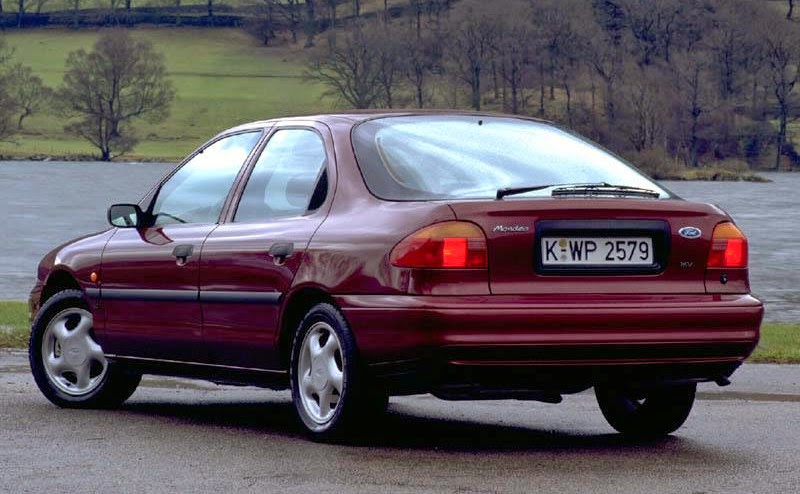
| 1993 Ford Mondeo proved a success |
Back in the early 1990's in Denmark, a battle was raging for the top selling brand. Toyota had a go for two years, then Opel for another two and finally Ford took control. They were the three main players numerically for that time period and interestingly, none of them were European makes.
In 1994 sales jumped amazingly, and at first I thought it a mistake. Then I found out from one source that it was due to several factors. Increasing employment, liberalization of mortgage lending and a decline in interest rates expanded opportunities for consumption generally. On top of that, the autumn of 1993 saw the introduced a scrapping scheme whereby owners of old cars was were given incentive to scrap their old bangers.
Points of note: Mainstream models dominated, with premium marques well down the list. Hyundai arrived and immediately had success. However, another new make, Lexus had plenty of work to do getting established.
Models to shine: For Ford, the Sierra/Mondeo and Escort were popular. Meanwhile at Toyota the Corolla and Carina were their star models. Opel had the Kadet/Astra and Vectra doing most of the work for that brand.
The percentage figure to the extreme right of the chart is market share for 1994.
| 90 | 91 | 92 | 93 | 94 | Make | 1990 | 1991 | 1992 | 1993 | 1994 | % |
| 3 | 3 | 3 | 3 | 1 | Ford | 8,407 | 8,335 | 8,571 | 9,758 | 19,102 | 14% |
| 1 | 1 | 2 | 2 | 2 | Toyota | 10,976 | 10,034 | 10,389 | 10,644 | 18,119 | 13% |
| 2 | 2 | 1 | 1 | 3 | Opel | 10,457 | 10,014 | 10,410 | 10,804 | 17,479 | 13% |
| 5 | 7 | 6 | 5 | 4 | Peugeot | 6,541 | 6,089 | 6,143 | 6,414 | 11,598 | 8% |
| 6 | 9 | 5 | 4 | 5 | VW | 6,043 | 4,404 | 7,704 | 7,231 | 10,588 | 8% |
| 4 | 5 | 4 | 7 | 6 | Mazda | 8,326 | 7,740 | 8,324 | 5,714 | 9,986 | 7% |
| 7 | 8 | 8 | 6 | 7 | Citroen | 4,834 | 4,740 | 4,235 | 5,798 | 9,113 | 7% |
| 9 | 10 | 9 | 9 | 8 | Fiat | 4,082 | 3,651 | 4,181 | 3,715 | 8,900 | 6% |
| 8 | 6 | 7 | 8 | 9 | Nissan | 4,318 | 6,411 | 5,128 | 4,156 | 5,269 | 4% |
| 11 | 14 | 11 | 12 | 10 | Volvo | 1,967 | 1,558 | 2,753 | 2,737 | 4,773 | 3% |
| 12 | 12 | 13 | 10 | 11 | Skoda | 1,910 | 1,687 | 2,048 | 2,887 | 4,466 | 3% |
| 15 | 13 | 12 | 13 | 12 | Renault | 1,373 | 1,657 | 2,143 | 1,988 | 3,507 | 3% |
| 10 | 4 | 10 | 11 | 13 | Mitsubishi | 2,013 | 8,037 | 3,951 | 2,860 | 2,725 | 2% |
| - | - | 23 | 18 | 14 | Hyundai | 310 | 958 | 2,265 | 2% | ||
| 14 | 16 | 15 | 15 | 15 | Lada | 1,469 | 1,234 | 1,336 | 1,085 | 1,746 | 1% |
| 13 | 11 | 14 | 14 | 16 | Honda | 1,858 | 1,775 | 1,420 | 1,231 | 1,587 | 1% |
| 28 | 24 | 26 | 22 | 17 | Seat | 101 | 240 | 162 | 409 | 1,491 | 1% |
| 19 | 15 | 16 | 16 | 18 | Audi | 823 | 1,448 | 1,305 | 966 | 1,477 | 1% |
| 16 | 19 | 19 | 17 | 19 | Mercedes | 1,016 | 792 | 819 | 958 | 1,312 | 1% |
| 18 | 17 | 17 | 19 | 20 | BMW | 934 | 1,087 | 1,058 | 954 | 1,312 | 1% |
| 17 | 18 | 18 | 20 | 21 | Saab | 991 | 953 | 877 | 778 | 1,054 | 1% |
| 21 | 21 | 21 | 23 | 22 | Suzuki | 519 | 662 | 456 | 395 | 594 | |
| 20 | 20 | 20 | 21 | 23 | Daihatsu | 783 | 681 | 683 | 564 | 283 | |
| 24 | 22 | 25 | 24 | 24 | Alfa Romeo | 274 | 278 | 210 | 185 | 257 | |
| 26 | 27 | 27 | 27 | 25 | Rover | 122 | 50 | 49 | 126 | 255 | |
| 25 | 23 | 22 | 25 | 26 | Subaru | 241 | 248 | 329 | 144 | 155 | |
| 29 | 30 | 34 | 28 | 27 | Chrysler | 63 | 24 | 12 | 40 | 115 | |
| 31 | 31 | 32 | 31 | 28 | Jaguar | 23 | 16 | 17 | 16 | 23 | |
| - | - | 29 | 30 | 29 | Lexus | 29 | 22 | 21 | |||
| 27 | 26 | 28 | 29 | 30 | Lancia | 111 | 54 | 36 | 25 | 15 | |
| - | 33 | 33 | 32 | 31 | Maserati | 4 | 14 | 13 | 10 | ||
| 32 | 32 | 35 | 33 | 32 | Porsche | 2 | 6 | 1 | 1 | 1 | |
| 30 | 25 | 24 | 26 | - | Yugo | 47 | 174 | 219 | 126 | ||
| 32 | - | - | 33 | - | Ferrari | 2 | 1 | ||||
| 23 | 29 | 30 | - | - | FSO | 283 | 41 | 17 | |||
| Others | 287 | 22 | 46 | 55 | 23 | ||||||
| Total | 80,913 | 84,146 | 85,385 | 83,758 | 139,621 |
No comments:
Post a Comment